Results
Generated by scripts/make_results_docs.py from results/*.json.
Simulation: do the statistics work?
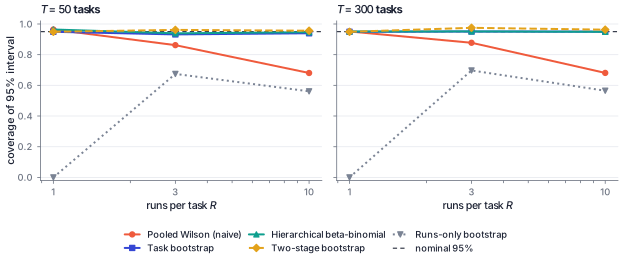
Coverage of nominal 95% intervals for the benchmark score (100 tasks, 2000 replications):
| runs/task | pooled Wilson | task bootstrap | BCa | hierarchical beta-binomial |
|---|---|---|---|---|
| 1 | 94.4% | 94.3% | 94.8% | 94.4% |
| 3 | 88.5% | 94.9% | 95.1% | 95.0% |
| 10 | 68.3% | 94.8% | 94.8% | 95.1% |
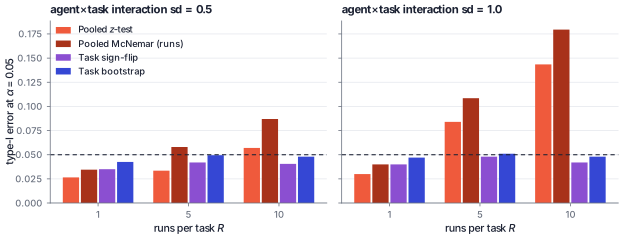
Type-I error at alpha = 0.05 (equal-skill agents, 100 tasks, 10 runs, strong interaction): pooled z-test 14.3%, pooled run-level McNemar 17.9%, task sign-flip 4.2%, task bootstrap 4.8%.
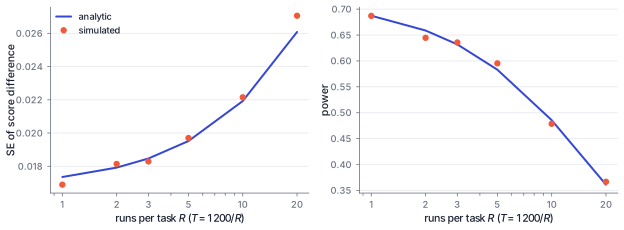
Fixed budget of 1200 attempts: power of the paired test by runs per task.
| runs/task | tasks | power |
|---|---|---|
| 1 | 1200 | 68.7% |
| 2 | 600 | 64.5% |
| 3 | 400 | 63.6% |
| 5 | 240 | 59.5% |
| 10 | 120 | 47.9% |
| 20 | 60 | 36.7% |
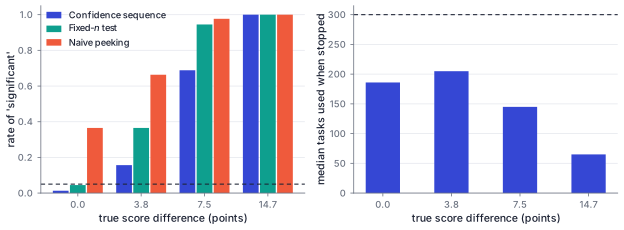
Sequential testing under the null: naive peeking declares a winner in 36.5% of runs, the confidence sequence in 1.5%, the fixed-n test in 4.5%.
Public results
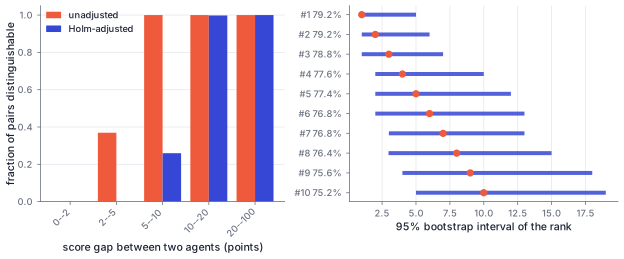
SWE-bench Verified (129 public submissions, 8256 pairs, one run each): 71.7% of pairs are distinguishable after Holm adjustment (86.7% unadjusted); of the 128 adjacent leaderboard positions, 0.0% are distinguishable.
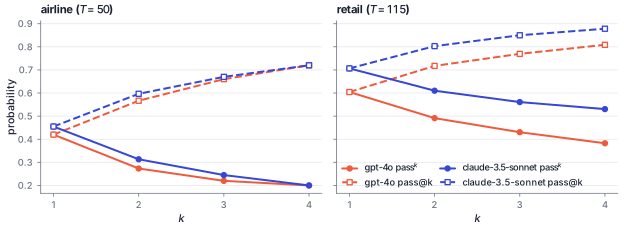
tau-bench (gpt-4o vs claude-3.5-sonnet, 4 trials per task):
| domain | tasks | diff (pts) | 95% CI | task-level p | pooled z p |
|---|---|---|---|---|---|
| airline | 50 | +3.5 | [-6.0, +13.0] | 0.545 | 0.480 |
| retail | 115 | +10.2 | [+3.9, +16.5] | 0.002 | 0.001 |
Local models on AgentAudit-Bench
7 local models, 120 core tasks, 10 runs per task, temperature 0.7.
| model | score | 95% CI | pass^k (k=max) | pass@k (k=max) | P(best) |
|---|---|---|---|---|---|
| qwen2.5-7b | 63.7% | [55.9%, 71.0%] | 40.8% (k=10) | 76.7% | 100% |
| qwen2.5-3b-q8 | 45.1% | [38.1%, 51.8%] | 15.8% (k=10) | 74.2% | 0% |
| llama3.2-3b | 33.6% | [27.3%, 40.3%] | 10.8% (k=10) | 62.5% | 0% |
| qwen2.5-3b | 31.8% | [26.2%, 37.8%] | 10.0% (k=10) | 68.3% | 0% |
| qwen2.5-1.5b | 13.6% | [9.3%, 18.3%] | 1.7% (k=10) | 34.2% | 0% |
| llama3.2-1b | 4.6% | [2.8%, 6.8%] | 0.0% (k=10) | 21.7% | 0% |
| qwen2.5-3b-q2 | 0.0% | [0.0%, 0.0%] | 0.0% (k=10) | 0.0% | 0% |
Variance shares: agent skill 25.1%, task difficulty 14.4%, agent x task 26.1%, run noise 34.4%. Pairs indistinguishable (Holm): 4.8%.